Kanger Glass-ceramic Co., Ltd.
Glass breakage rates in production, handling, and transportation are useful only when the counted event, population, and stage are defined. Count broken parts against the number exposed to the same stage and period, preserve separate records for rejects and rework, and avoid counting one pane several times as it moves through the investigation. For an OEM appliance-glass program, the aim is to locate where damage first appears and reduce that loss without hiding it in yield reports. There is no universal acceptable breakage percentage for every material, panel size, process, package, or transport route.
Define the event before calculating a percentage
Decide what the metric includes. A shattered pane, an edge chip that causes rejection, a cosmetic mark, a process test break, and an approved destructive sample are different events. They may all affect yield, but combining them into one unnamed loss rate makes corrective action difficult. Use clear categories and keep planned tests separate from unplanned damage.
For breakage rate, state the count of affected panes and the corresponding exposed population. If one pane has several defects, define whether the metric counts panes or defects. A pane-based rate should count that pane once in the relevant population. Keep replacement parts identifiable so the original loss and the delivered quantity remain reconcilable. The calculation should answer a real operational question rather than make the report look favorable.
Choose denominators that match each stage
For a particular handling transfer, the denominator is the number of panes exposed to that transfer during the defined period. For transportation, use a population that matches the route and shipment scope being evaluated. Starting-sheet quantity, finished-pane quantity, shipped panes, and received panes are not interchangeable. A process that nests several parts from one sheet needs a clear unit for the rate.
Calculate the rate as affected panes divided by exposed panes, multiplied by one hundred percent, when that is the defined metric. Show both counts beside the percentage. A small population can produce a large-looking percentage from one event, so the counts are essential. Label the period and scope. Do not compare a month’s factory loss with one transport incident as if they describe the same exposure.
Record where damage is detected and where it may originate
Detection stage and suspected cause stage are different fields. A broken pane found at receiving may have been damaged during packing, loading, transportation, unloading, or later handling. Record the first observed condition without automatically assigning it to the carrier. Retain the evidence needed to investigate the boundary, including package condition and the last acceptable inspection.
Use part, lot, package, shipment, and process identifiers where available. Record material family, thickness, geometry, relevant features, and surface condition so different part groups can be compared sensibly. A transport result for a simple rectangular pane may not represent a shaped appliance component with cutouts. Avoid flattening these differences into a single site-wide rate that cannot explain the actual loss.
Build a small event record that can be maintained
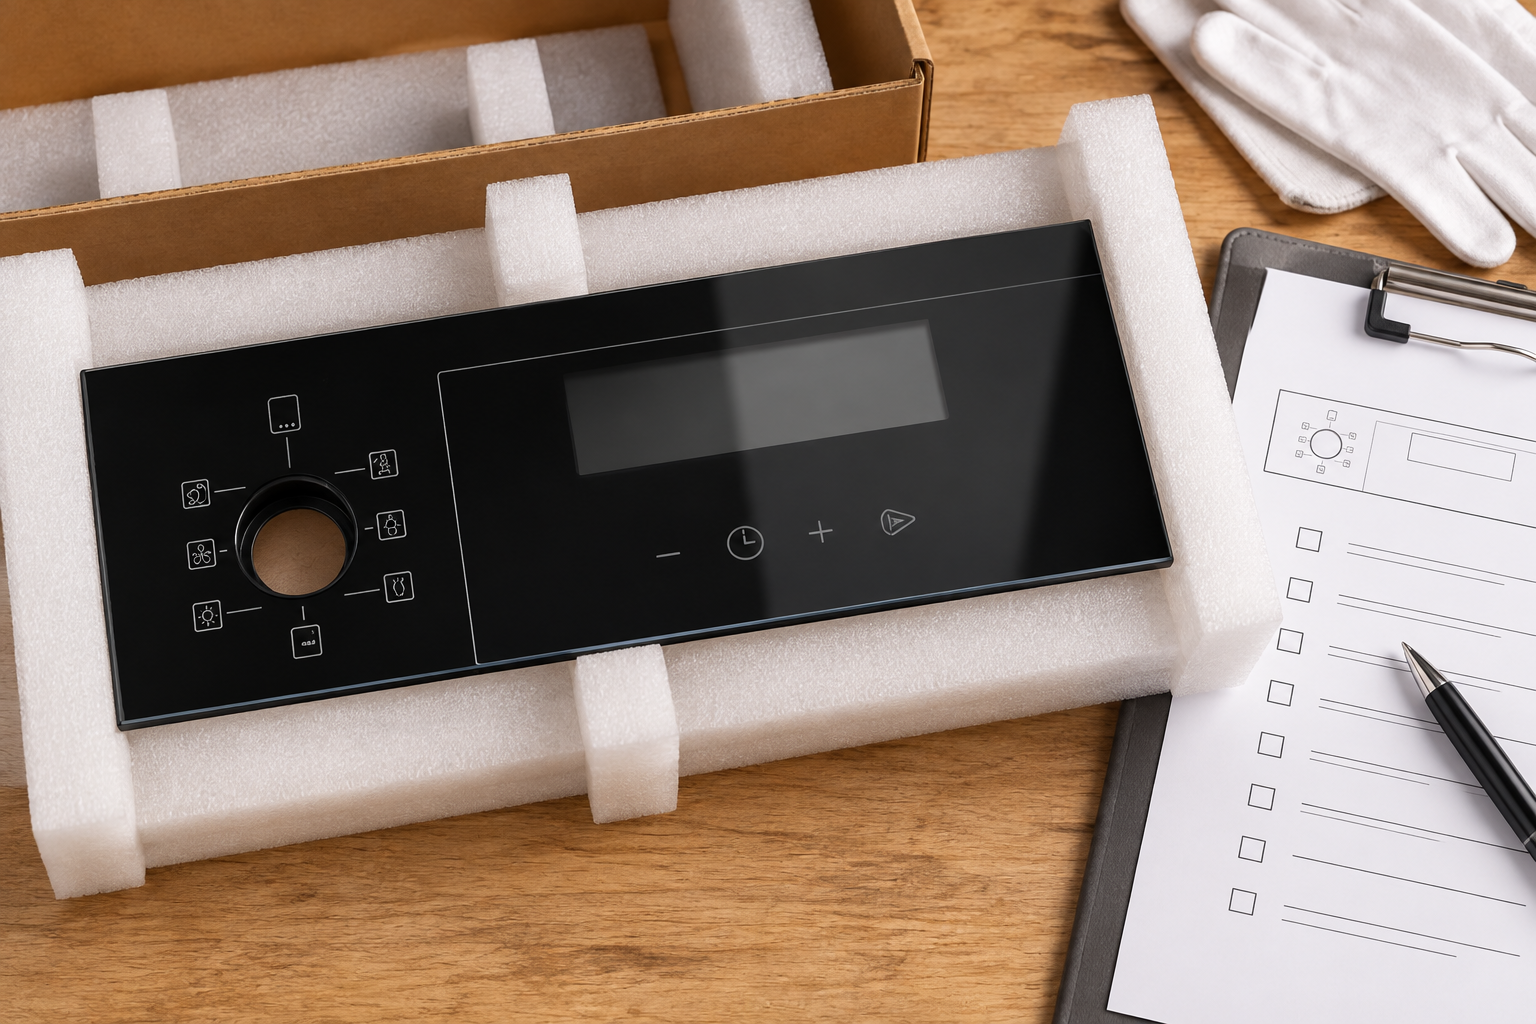
The record should contain date, part and revision, quantity affected, exposed quantity or batch link, detection stage, damage category, package or fixture identity, and relevant photographs. Add confirmed cause only after investigation, with a way to distinguish it from a hypothesis. Keep containment and corrective action separate so a held lot is not reported as a completed correction.
Assign responsibility for recording the event at the stage where it is found. The system should be simple enough to use consistently. A detailed form that operators rarely complete is less valuable than a reliable record of the essential fields. Review missing identifiers and unclear categories regularly. If several teams record the same incident, connect their reports through one event identity rather than adding their quantities together.
Compare like exposures before choosing a priority
Group results by a relevant factor such as part family, transfer, package design, route, or supplier lot. Compare equivalent periods and populations where possible. A change in product mix can alter the overall rate even if each process remains stable. Show the counts and the mix before claiming that a new package or machine caused an improvement.
Look for repeatable concentration of loss. A cluster at one unloading transfer calls for different investigation from damage first detected after drilling or after assembly. Prioritize by loss, consequence, repeatability, and the ability to verify a correction. Avoid treating every one-off event as proof of a systemic failure, but do not dismiss a serious safety-related event simply because its numerical rate is low.
Use a clearly labeled calculation example
Imagine a defined transfer with one thousand pane movements during a reporting period and twelve panes rejected for breakage first observed after that transfer. Under that event definition, the detected breakage rate is twelve divided by one thousand, or 1.2 percent. The figure describes that hypothetical population and observation boundary. It is not a Kanger result, an industry benchmark, or an acceptable limit.
If four of those events were later traced to earlier edge damage, the detection record should remain intact while the confirmed-cause field is updated. Do not delete the receiving event to improve the receiving team’s rate. The organization can report detected loss and cause-attributed loss as distinct views, provided both use clear definitions and do not double-count panes. This preserves the evidence and makes responsibility discussions more factual.
Event and metric definition table
| Field | Definition to maintain | Why it matters |
|---|---|---|
| Unit counted | Pane, sheet, shipment, or defect, stated explicitly | Prevents mixing unlike quantities in the rate |
| Event category | Breakage, edge-damage reject, cosmetic reject, or planned test | Keeps different loss mechanisms separate |
| Exposed population | Quantity that passed through the named stage and period | Makes the denominator match the question |
| Detection boundary | First stage at which the damage was observed | Preserves the actual evidence without guessing the cause |
| Part and exposure | Revision, material, geometry, package, fixture, or route | Supports comparisons among similar conditions |
| Cause status | Uninvestigated, hypothesis, confirmed, or unresolved | Stops a suspected cause from becoming an unsupported fact |
| Action and verification | Containment, correction, owner, and verification population | Shows whether the proposed change actually reduced the relevant loss |
The table defines an operational record. Any target or alert limit should come from the program’s baseline, risk, and agreed requirements, not from an invented universal rate.
Investigate the handling and package interfaces
Inspect the support, contact points, separators, restraints, package condition, and movement route relevant to the event. Photograph the received state before unpacking when damage is found in transit. Compare packing records and the last acceptable inspection. A crushed package is useful evidence, but an intact outside does not prove that internal movement or contact never occurred.
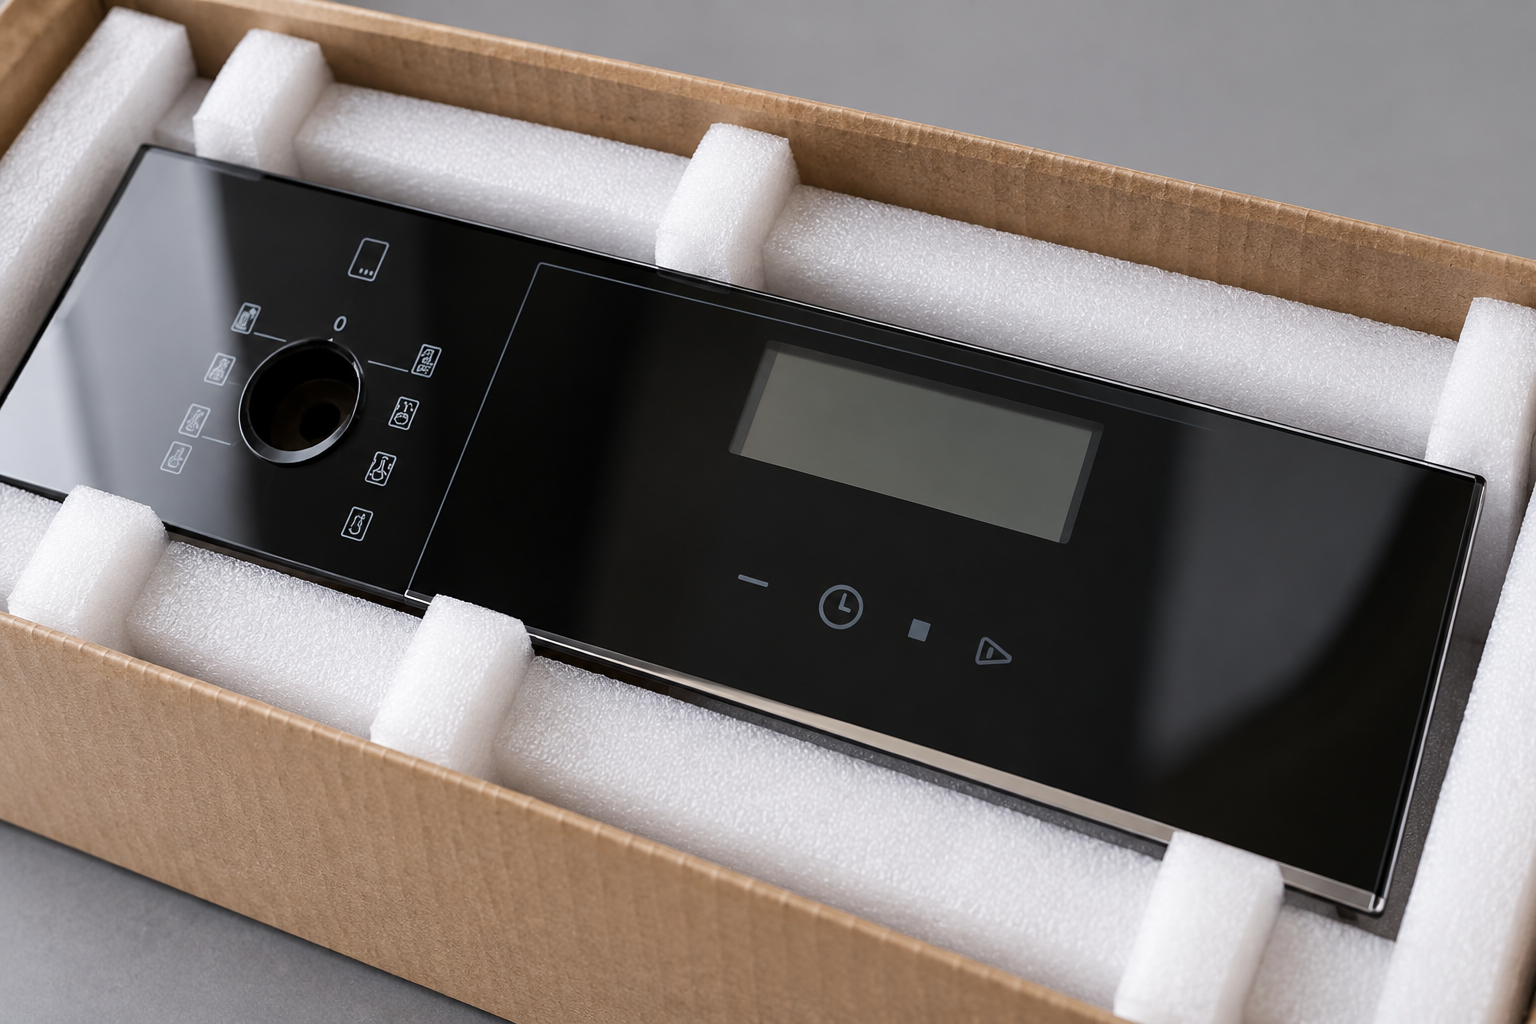
For appliance-control panes, review protected viewing faces, edge and corner contact, and the way parts are removed from the package. A package that protects the pane in transit can still create a risky unpacking method. Consider the whole handoff. Any change should be tested with representative parts and the actual exposure sequence that the correction is intended to address.
Verify a correction using the same metric definition
Define the population, time window, part mix, and stage for the verification. Keep the event definition the same so a before-and-after comparison is meaningful. Record other changes that occurred at the same time. If a new package is introduced along with a different route and a different panel size, the comparison cannot isolate the package effect without further evidence.
Review both loss counts and unintended consequences. A tighter restraint might reduce movement but introduce contact marks or handling difficulty. A process adjustment might improve one edge condition while creating another defect. Use the relevant inspection and functional requirements alongside the breakage rate. The outcome should be a verified improvement in the component program, not only a lower number produced by changing what gets counted.
Share a useful record with the glass supplier
Provide the affected part, lot, event definition, quantities, last acceptable stage, photographs, package or fixture details, and known exposures. Ask Kanger or the responsible processor for relevant batch and inspection information. Kanger’s appliance-glass page establishes the product connection, but it does not provide a universal breakage benchmark or prove responsibility for a particular event.
Keep the supplier review connected to a specific investigation question. If evidence is missing, state the gap and improve the next event record. Agree on containment, sample retention, correction, and verification responsibilities. A shared definition and traceable record can make a difficult loss discussion much clearer than exchanging percentages that use different populations and different meanings of breakage.
Frequently asked questions
What is the basic breakage-rate formula?
For a defined pane-based metric, divide affected panes by panes exposed to the same stage and period, then express the result as a percentage. Show both counts and the scope.
Is there one normal rate for all glass shipments?
No universal rate is established here. Material, geometry, packaging, handling, route, and event definitions differ. Use a consistent baseline and agreed program requirements.
Should receiving damage be assigned to transportation automatically?
No. Record the detection stage, then investigate the likely origin using package, handling, and inspection evidence. Keep observation and confirmed cause separate.
How do we avoid double-counting a damaged pane?
Use one event or pane identity to link reports from several teams. Define whether the metric counts panes or defects and keep replacements and rework connected to the original record.
Related appliance-glass resources
- Thermal Shock Resisitance Tempared Glass For Household Appliances Panel Product
- Tempered Glass Appliance Panels: OEM Specification Guide
- What should OEMs document when packaging and shipping glass-ceramic panels?
- Does Tempered Glass Shatter? Key Facts and Practical Guidance
Sources and further reading
- NGA — fabrication before heat treatment
- NIST — measurement uncertainty
- GGF Glazing Manual — architectural-glass context, not an appliance specification
Educational video: Annealing and Tension in Glass
This museum explanation introduces tension and thermal history in glass. It supports the material discussion; it is not a heat-soak procedure or a failure diagnosis.

Watch Annealing and Tension in Glass from Corning Museum of Glass